
*For the best experience view in the landscape mode.
| FY 2021-22 | FY 2020-21 | ||
| Financial Capital | (Rs. in crore) | (Rs. in crore) | |
| Current Assets | Rs. 4,738 | Rs. 4,466 | |
| Order Booking | Rs. 9,410 | Rs. 4,784 | |
| Net Worth | Rs. 3,492 | Rs. 3,251 | |
| Net Block of Assets | Rs. 1,239 | Rs. 1,266 | |
| Borrowings | Rs. 355 | Rs. 317 |
| Manufactured Capital | |||
| Manufacturing Plants | 14 | 14 | |
| Domestic and International Offices | 56 | 58 | |
| Project Sites | 261 | 240 | |
| New Capacity Added | NA | Chemical (Dahej) (10,000 m3 per annum) | |
| Material Consumed (Rs. in crore) | Rs. 3,485 | Rs. 2,539 |
| Human Capital | |||
| No. of Internal Audits | 1,436 | 1,105 | |
| No. of External Audits | 22 | 20 | |
| No. of Internal Auditors Certified | 27 | 20 | |
| No. of Permanent Workmen Deployed | 876 | 975 | |
| No. of Permanent Employees (Thermax Group – including subsidiaries and excluding workmen) |
3,758 | 3,627 | |
| No. of Man-hours of Training | 46,226 | 65,410 | |
| Total Cost of Employees | 13.3% | 15.8% | |
| Investment in Training and Development (Rs. in crore) | Rs. 1.47 | Rs. 1.27 |
| Intellectual Capital | |||
| R&D Spend as % of Group Turnover | 0.51% | 0.56% | |
| No. of Employees in R&D Team | 137 | 111 | |
| Investment in Technology Initiatives (Rs. in crore) |
Rs. 17.7 | Rs. 16.7 | |
| No. of Tie-ups with External | New tie-up: 1 | New tie-up: 1 | |
| Research Firms | Continued: 1 | Continued: 5 |
| Social and Relationship Capital | |||
| Total CSR Spend (Rs. in crore) | Rs. 7.54 | Rs. 7.84 | |
| No. of Suppliers Trained on Sustainability | 70 | 84 | |
| No. of Dealers | 154 | 132 | |
| No. of Green Channel Vendors | 243 | 222 | |
| No. of MSME Suppliers | 2,447 | 2,018 | |
| No. of Customer Engagements | 109 | 668 |
| Natural Capital | |||
| Renewable Energy Generated | 15,147 GJ (4,207 MWh) | 15,201 GJ (4,222 MWh) | |
| Non-Renewable Energy Consumed | 3,37,899 GJ (93,861 MWh) | 2,79,312 GJ (77,587 MWh) | |
| Water Consumed | 8,93,567 m3 | 8,09,018 m3 | |
| Trees Planted (Saplings) | 5,957 | 4,310 | |
| Capex on Projects Related to Carbon Footprint Reduction (Rs. in crore) | Rs.1.39 | Rs. 1.1 | |
| Zero Liquid Discharge Installations | 7 | 7 | |
| Cumulative Rainwater Harvested | 41,625 m3 | 41,625 m3 |
We believe that the Company is accountable to its stakeholders to treat them with fairness and equality while also contributing to their wealth creation. An overarching criterion in all Thermax’s activities is integrity and sustainability. In fulfilling its responsibilities to its stakeholders, the Company is transparent in its dealings. This Integrated Report covers our philosophy on corporate governance, our policies, ethics and code of conduct. It also contains information on appointments, various Board committees, and nominations, as well as remuneration of the Board and senior management.
Air Pollution Control

Wastewater Treatment
Hazardous Waste Treatment
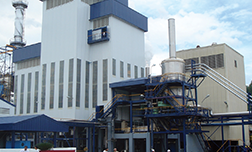
Waste to Energy Generation
Customers
Employees
Vendors and Business Partners
Owners and Shareholders
Government Authorities
Communities and Academic Groups
Future Generations
SO1 - Increase the share of green offerings
SO2 - Grow products and services portfolio
SO3 - Focus on internationalisation
| FY 2021-22 | FY 2020-21 | |
| Financial Capital | ||
| Total Revenue (Rs. in crore) | Rs. 6,128 | Rs. 4,791 |
| Profit After Tax (Rs. in crore) | Rs. 312 | Rs. 207 |
| Operating Cash Flow (Rs. in crore) | Rs. 325 | Rs. 769 |
| Operational EBITDA (Rs. in crore) | Rs. 456 | Rs. 385 |
| Earnings Per Share | Rs. 27.73 | Rs. 18.34 |
| Remuneration including Retirement Benefits to Employees (Rs. in crore) | Rs. 813 | Rs. 759 |
| Contribution to Exchequer (Rs. in crore) | Rs. 225 | Rs. 189 |
| Manufactured Capital | ||
| Fixed Asset Turnover Ratio | 4.89 times | 3.72 times |
| Total Power Generated | 785 MW | 588 MW |
| Power Generated through Assets Operated | 4,058 GWh | 3,819 GWh |
| Environment Friendly Vapour Absorption Cooling | 1,15,771 NTR | 1,07,195 NTR |
| Air Treated through Air Pollution Control System | 73.16 million m3/hour | 30.6 million m3/hour |
| Water Treated and Recycled | 248.7 MLD | 225 MLD |
| Heating Solutions – Quantity of Heating done | 4,061 MWTH | 3,283 MWTH |
| Total Chemicals Manufactured | 26,022 MT | 25,990 MT |
| Human Capital | ||
| No. of Whistleblower Complaints Resolved | 9 received and 7 resolved | 12 received and resolved |
| No. of Anti-Social Harassment Act Complaints Received and Resolved | Nil | Nil |
| Regrettable Attrition Rate | 11% | 7% |
| Value Added Per Rupee of Employee Cost | Rs. 3.25 | Rs. 2.97 |
| Lost Time Injury Frequency Rate | 0.33 | 0.28 |
| % of Employees with Tenure of over 10 years in Thermax | 36.24% | 29.31% |
| No. of Fatalities among Employees | Permanent - 1 Contractual - 6 | Permanent - 1 Contractual - 0 |
| Intellectual Capital | ||
| No. of Patents Applied and Granted | Applied - 11 Total Granted - 14 | Applied – 4 Total Granted – 22 |
| No. of Trademarks Registered | Applied - 9 Registered - 6 | Applied - 2 Registered - 1 |
| No. of Customer Processes Digitalised | 12 | 15 |
| Equipment with Remote Monitoring Functionality | 401 | 369 |
| Social and Relationship Capital | ||
| No. of Families Directly Benefited through CSR | 8,070 | 5,000 |
| No. of Student Beneficiaries | 3,150 | 2,000 |
| % of Customer Complaints Resolved | 98.3% | 98.8% |
| % of Material Sustainably Sourced | 37% | 35.6% |
| No. of Active MSME Suppliers | 2,446 | 2,018 |
| No. of Complaints Related to Unfair Trade Practices, Irresponsible Advertising or Anti-competitive Behaviour | Nil | Nil |
| No. of Orders through Channel Network | 6,840 | 5,787 |
| Natural Capital | ||
| Carbon Emissions Reduced | 2,362 tCO2e | 2,174 tCO2e |
| Energy Saved | 20,551 GJ (5,709 MWh) | 17,464 GJ (4,851 MWh) |
| Water Reused and Recycled | 2,24,488 m3 | 216,413 m3 |
| Rainwater Harvested | 20,284 m3 | 25,253 m3 |

